Austin Market Report: October 2026
Austin metro buyers signed 9% fewer contracts than last October. Homes priced right sold in two weeks at 99% of asking, and over half of sales had seller-paid buyer costs.
October 2026 brought fewer buyers to the Austin metro. Buyers signed 1,951 contracts on detached single-family homes, 9% fewer than in October 2025. There are 10,878 homes for sale today, about five and a half months of supply at October's pace of contracts.
Every figure below comes from the broker data behind real contracts and closed sales (BBO) for detached single-family homes in Travis, Williamson, Hays, Bastrop and Caldwell counties, pulled November 2, 2026.
October at a glance
| Measure | October 2026 | October 2025 | Change |
|---|---|---|---|
| Contracts signed | 1,951 | 2,148 | −9% |
| Median price per square foot | $205 | $214 | about −4% |
| Median sale price | $415,000 | $448,182 | |
| Median days on market (sold homes) | 53 | 56 | |
| Median sale price as a share of original asking price | 94% | 93% | |
| Sold over asking | 11.6% | 11.5% |
Right now, 61% of the homes for sale have cut their price at least once. Price per square foot is the fairer year-over-year comparison here: the median sale price also moves with the mix of homes that happened to sell.
A note on closings: 1,756 October closings are recorded so far. Closings keep posting to the MLS for weeks after the sale, so that count will rise. That is why this report leads with contracts, which are recorded when they are signed.
What sold, city by city
| City | October sales | Median sale price | vs. last October | Median days on market |
|---|---|---|---|---|
| Austin | 530 | $597,450 | +3% | 38 |
| Georgetown | 188 | $410,000 | −11% | 51 |
| Round Rock | 106 | $399,950 | −4% | 38 |
| Leander | 87 | $440,000 | 0% | 46 |
| Kyle | 85 | $306,567 | +1% | 79 |
| Pflugerville | 73 | $375,000 | −9% | 62 |
| Hutto | 73 | $309,514 | −12% | 61 |
| Liberty Hill | 58 | $499,900 | −9% | 88 |
| Buda | 55 | $365,000 | +9% | 69 |
| Cedar Park | 54 | $574,000 | +18% | 37 |
ZIP codes that stood out
Among ZIP codes with 15 or more October sales:
- Hottest: 78723, Austin. 19 sales, a median 18 days on market, 21% sold over asking, and a median 98% of original asking price. Median sale price $605,000.
- Most sales over asking: 78626, Georgetown. One in four of its 24 sales closed above the asking price. Median sale price $345,500.
- Biggest discounts: 78644, Lockhart. 22 sales at a median 85% of original asking price, after a median 82 days on market. Median sale price $337,500.
Communities with the most sales
| Community | City | October sales |
|---|---|---|
| Sun City | Georgetown | 54 |
| Santa Rita Ranch | Liberty Hill | 27 |
| Winfield Park | Hutto | 22 |
| Sunfield | Buda | 20 |
| Waterstone | Kyle | 20 |
Communities are counted across all of their sections and phases.
County by county
| County | Median sale price | vs. last October | Median days on market | Months of supply | Contracts (Oct. 2026 vs. 2025) |
|---|---|---|---|---|---|
| Travis | $515,000 | −1% | 45 | 5.3 | 833 vs. 939 |
| Williamson | $388,995 | −7% | 53 | 5.5 | 680 vs. 774 |
| Hays | $381,900 | −4% | 67 | 5.5 | 326 vs. 314 |
| Bastrop | $351,000 | +3% | 91 | 9.0 | 75 vs. 98 |
| Caldwell | $268,500 | +3% | 65 | 6.4 | 37 vs. 23 |
Travis is the most expensive county and the steadiest. Williamson had the largest price decline of the five. Bastrop is the slowest market, and Caldwell, the smallest, is the only county where contracts rose.
Where the market is heating up
Cities with 25 or more October sales.
- Hutto: 108 contracts, up from 73 last October (+48%). 19% of homes sold over asking. 3.9 months of supply.
- Buda: 80 contracts, up from 60 (+33%). Median sale price $365,000, up 9%. Homes sold at a median 96% of their original asking price.
- Cedar Park: the tightest supply on the list at 3.1 months; homes sold in a median 37 days.
- Round Rock: a median 38 days on market and 4.8 months of supply.
Where buyers have the most leverage
- Leander: 75 contracts, down from 111 (−32%), with 7.6 months of supply.
- Liberty Hill: a median 88 days on market; the typical home sold at about 91% of its original asking price, the deepest discount on the list. 7.5 months of supply.
- Manor: 7.9 months of supply.
- Bastrop (city): 8.2 months of supply.
Biggest price declines
| City | Median sale price, Oct. 2026 | vs. Oct. 2025 |
|---|---|---|
| Georgetown | $410,000 | −11% |
| Pflugerville | $375,000 | −9% |
| Dripping Springs | $593,495 | −13% |
The city of Austin
Austin went the other way: the median sale price rose about 3% to $597,450, and homes sold in a median 38 days, among the fastest on the list. Contracts fell 18%, from 692 to 567.
Price decides it
| Days on market | October sales | Median share of original asking price |
|---|---|---|
| 0 to 14 days | 359 | 99.0% |
| 15 to 30 days | 257 | 96.4% |
| 31 to 60 days | 343 | 94.1% |
| 61 to 90 days | 257 | 91.8% |
| More than 90 days | 540 | 88.1% |
The longer a home sat, the less of its original price it got. October 2025 showed the same pattern: 99.6% in the first two weeks, 87.4% after 90 days.
Sellers are paying buyer costs
55% of October's closed sales (970 of 1,758) recorded seller-paid buyer costs, with a typical amount of $10,000. A year ago it was 53%, with a typical amount of $9,909.
Our take
Is it a good time to buy? If the monthly payment works for you, yes. Buyers have the leverage: five and a half months of supply, fewer competing offers and sellers who are paying closing costs. Know your real monthly payment first, then negotiate, and ask for help with closing costs. Homes that have been on the market longest are where the room is.
Is it a good time to sell? It is a market where price decides everything. Price it right in the first two weeks, based on what has actually sold near you, not on what is listed. Expect to be asked for help with the buyer's costs.
Method: detached single-family homes (property type Residential, sub-type Single Family Residence) in the five Austin MSA counties. Contracts are counted by contract date. Months of supply is homes for sale today divided by October contracts. Medians are of closed sales with a recorded close price above $50,000. Source: BBO broker data, pulled November 2, 2026. The next report publishes on the second of every month.
Join the conversation
More from Ready Front Pulse
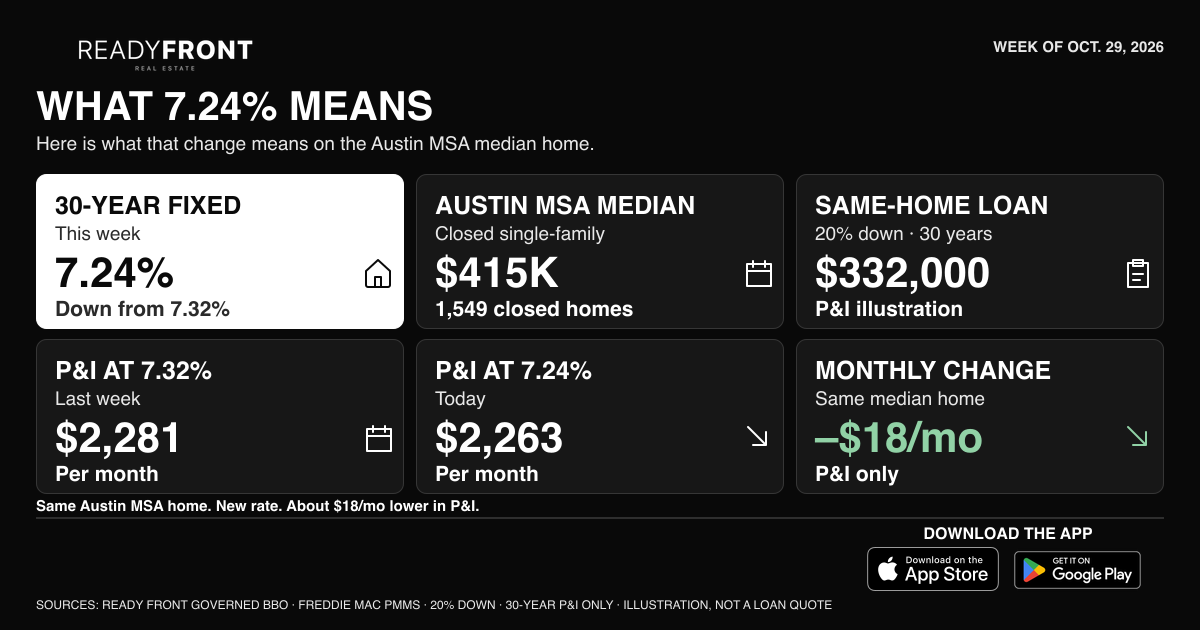
Mortgage Rates Ease Again: 30-Year Falls to 7.24%
Freddie Mac's survey for October 29, 2026 shows the 30-year fixed down 8 basis points to 7.24% and the 15-year at 6.60%, a second straight weekly decline and the lowest reading this month.
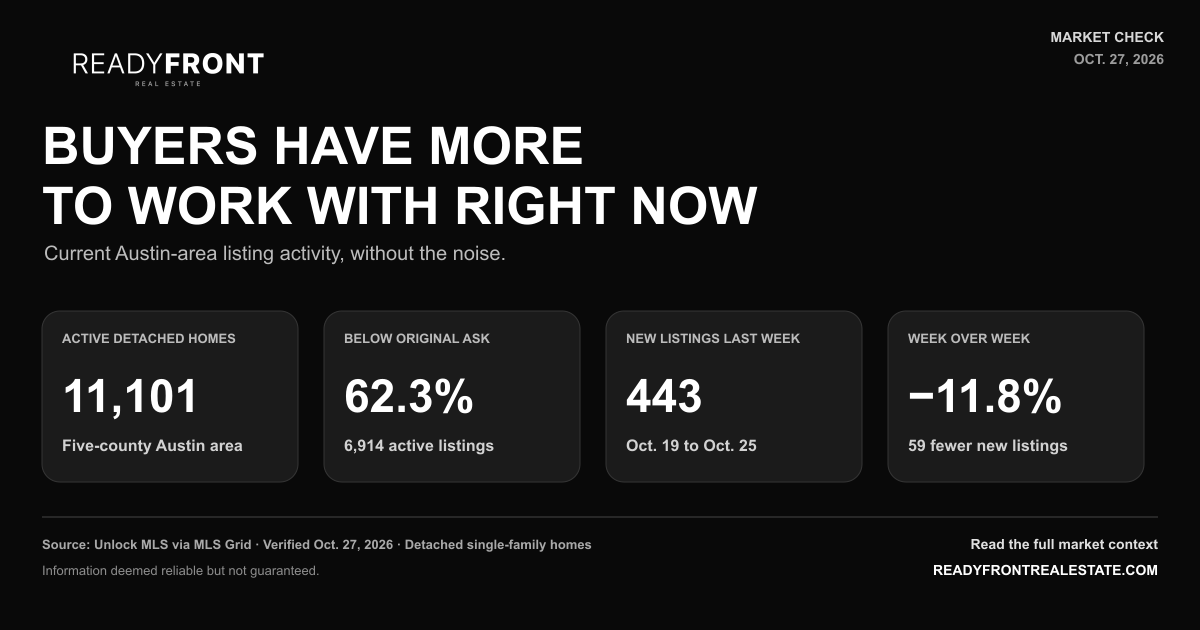
Buyers Have More to Work With Right Now
There are 11,101 active detached homes across the Austin area, and 62.3% are below their original asking price. Here is what that actually means before you move.
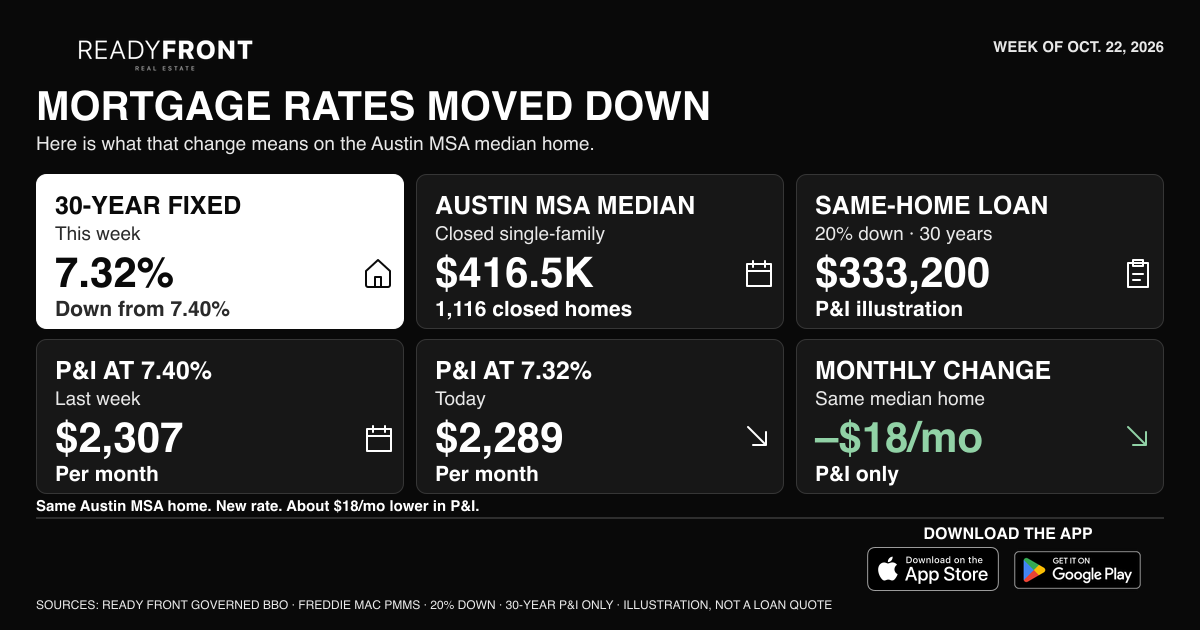
Mortgage Rates Break a Seven-Week Climb: 30-Year Falls to 7.32%
Freddie Mac's survey for October 22, 2026 shows the 30-year fixed down 8 basis points to 7.32% and the 15-year at 6.68%, the first decline after seven straight weekly increases.