Round Rock September Market Update
Round Rock’s September closings moved faster than the regional middle.
September at a glance
- Active Homes
- 549
- Median Sold
- $440,000
- Closed Sales
- 118
- Median DOM
- 42.5
The September picture
Round Rock recorded 118 closings and a 42.5-day median, compared with 53 days for the broader MSA in the same frozen review. Its $440,000 median sold price was close to the regional $439,000 median, but those similar medians do not make the homes interchangeable.
Another 149 accepted homes entered the market during September. That activity and the month-end inventory are different views of the market: new listings measure arrivals during the month, while active homes measure listings still available at the cutoff.
Pricing and negotiating room
The median sold-to-final-list ratio was 98.6%. That compares each closing with its final asking price, not its original list price, and does not subtract seller concessions. It describes the middle transaction, not the discount every buyer received.
Price reductions appeared on 287 distinct accepted listings during September. That is a useful reason to examine a specific home's price history and competition; it is not a forecast that every seller will reduce the price. The $193 median sold price per square foot is another comparison point, not a substitute for matching location, size, condition and lot.
What it means for sellers
A 42.5-day median is the midpoint of an even-sized closing sample, not a reporting error. The useful seller question is how a particular home compares with the 549 listings still active at month-end.
A 42.5-day median for completed sales makes pricing and presentation worth getting right at launch. There were also 29 accepted listing identities with a September expiration date. Expiration is a listing event, not proof that a home cannot sell. Compare against the homes a buyer would actually choose instead of relying on a citywide median alone.
What it means for buyers
The median sold-to-final-list ratio was 98.6%, leaving less room than a headline about price cuts alone might suggest. Review the final asking price and the full price history before assuming a large discount.
Use this report to set questions, then narrow the analysis to your neighborhood, property type and budget. Compare recent closed sales with today's competing homes and ask how price changes, repairs and concessions affect the specific opportunity. The September snapshot does not guarantee current inventory or an individual seller's terms.
Want to narrow this down to the Round Rock homes that matter to your move? Contact Raoul for a property-specific conversation. Contact Raoul Rowe at (737) 210-1690.
Methodology & Sources
September 2026 · Round Rock · Single-family detached homes · Unlock MLS via MLS Grid.
Scope and calculations
Single-family detached homes, including new construction and resale. Same accepted frozen MSA population; land, condos, townhomes and malformed/non-dwelling records excluded. No classification change.
City is exact retained MLS City field inside the five-county Austin MSA, not a certified municipal-boundary polygon. ZIP is exact retained PostalCode where present.
Distinct accepted Austin MSA detached-house listing identities with last supported Active source status immediately before October 1, 2026 00:00 America/Chicago.
2026-09-30 23:59:59.999 America/Chicago
Accepted listing identities with September ListingContractDate.
Accepted listing identities with September CloseDate and source Closed status.
Median positive ClosePrice in September accepted closed cohort.
Distinct accepted listing identities with at least one verified September source price decrease; repeated reductions count once. Not the number of reduction events and not limited to month-end active inventory.
Median integer DaysOnMarket >= 0 among accepted September closings. Zero- and one-day sales retained. Negative/missing/noninteger values omitted only from DOM, not sales or prices.
Median of individual ClosePrice / final ListPrice × 100; not ratio of aggregate medians, not original asking price and not net of concessions.
Distinct accepted identities with September ExpirationDate under frozen retained-source convention; not all market exits or sales failures.
Median of individual ClosePrice / positive LivingArea, not median price divided by median size.
Distinct MLS listing identities; not deduplicated physical properties
Unlock MLS via MLS Grid, retained Ready Front source evidence.
Retained-source coverage, not exhaustive certification of all MLS events or transactions. Previously unresolved class/source holds remain excluded. Active source-status reconstruction is not retroactively reduced for late-reported September30 expirations.
Join the conversation
More from Ready Front Pulse
Austin Market Report: October 2026
Austin metro buyers signed 9% fewer contracts than last October. Homes priced right sold in two weeks at 99% of asking, and over half of sales had seller-paid buyer costs.
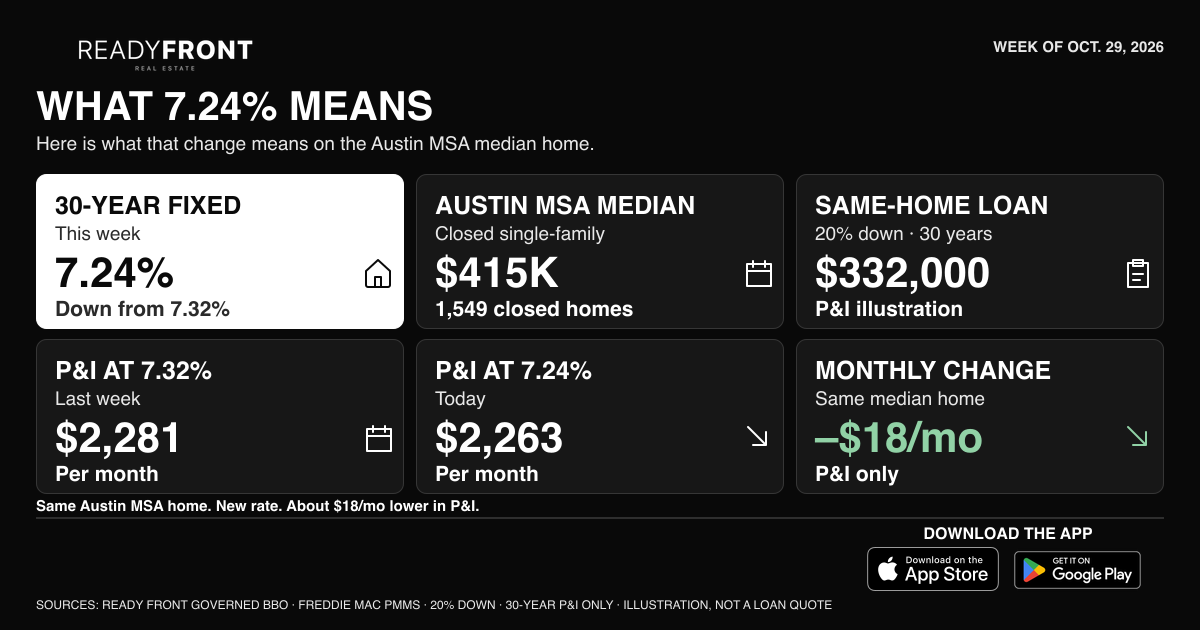
Mortgage Rates Ease Again: 30-Year Falls to 7.24%
Freddie Mac's survey for October 29, 2026 shows the 30-year fixed down 8 basis points to 7.24% and the 15-year at 6.60%, a second straight weekly decline and the lowest reading this month.
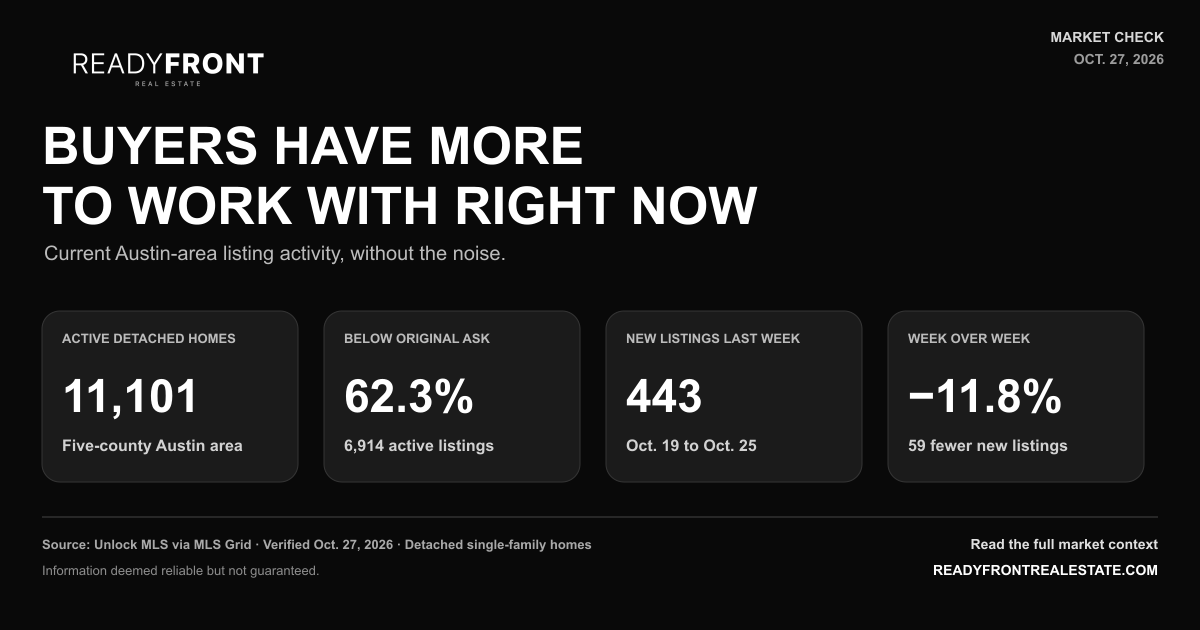
Buyers Have More to Work With Right Now
There are 11,101 active detached homes across the Austin area, and 62.3% are below their original asking price. Here is what that actually means before you move.