Mortgage Rates Halt Multi-Week Climb: 30-Year Holds at 7.40%
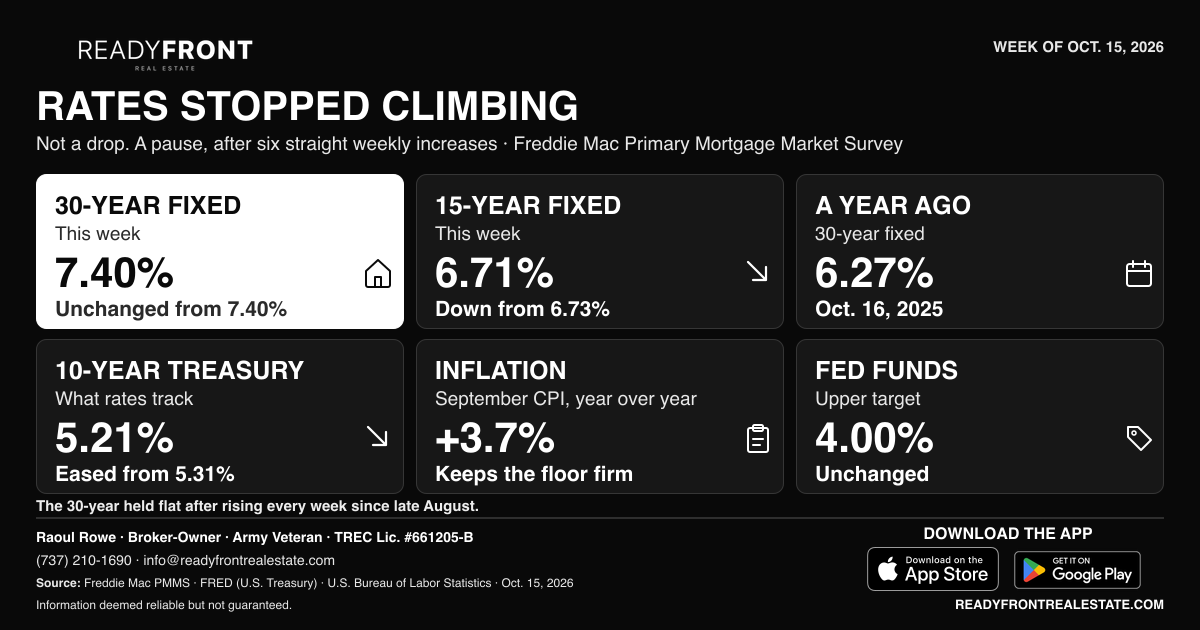
Freddie Mac’s survey for October 15, 2026 shows the 30-year fixed unchanged at 7.40% and the 15-year at 6.71%, ending a six-week run of increases as the 10-year Treasury eased.
The relentless climb in borrowing costs took a breather this week. According to Freddie Mac’s Primary Mortgage Market Survey released today, October 15, 2026, the benchmark 30-year fixed-rate mortgage held flat, snapping a multi-week streak of consecutive increases.
The weekly benchmark
| Loan type | Last week (Oct. 8) | This week (Oct. 15) | Week over week | One year ago |
|---|---|---|---|---|
| 30-year fixed-rate | 7.40% | 7.40% | Unchanged | 6.27% |
| 15-year fixed-rate | 6.73% | 6.71% | −0.02 (2 basis points) | 5.52% |
Source: Freddie Mac Primary Mortgage Market Survey, October 15, 2026. One-year-ago figures are the survey week of October 16, 2025.
Freddie Mac’s own summary of the week: “The average 30-year fixed-rate mortgage remained unchanged this week.”
What actually moved underneath
Weekly mortgage moves are often blamed on the Federal Reserve. They track long-term bond yields and inflation expectations far more closely.
- The 10-year Treasury eased. The benchmark yield pulled back from 5.31% on October 5 to 5.21% on October 13. Conforming mortgages price off the 10-year note, so that retreat took the immediate upward pressure off consumer loan pricing. (Federal Reserve Bank of St. Louis, series DGS10)
- Inflation is still the floor. September’s Consumer Price Index rose 3.7% year over year and 0.65% in the month alone. That reading is what keeps the 30-year average anchored above 7%. (U.S. Bureau of Labor Statistics via FRED, series CPIAUCSL)
- The Fed is holding. The federal funds target range remains at an upper bound of 4.00%. (Federal Reserve)
What this means if you are buying
Read the number honestly: rates did not fall this week. The 30-year did not move at all, and the 15-year slipped two basis points, which is a few dollars a month on a typical loan. The story is the direction change. After rising every week since late August, the climb stopped.
For context on the climb itself, the 30-year has moved 6.71% → 6.76% → 6.95% → 7.03% → 7.28% → 7.40% over the previous six surveys, and it sits 1.13 points above where it stood a year ago.
That gap is why so many Austin-area sellers are meeting buyers on price. Payment math, not sentiment, is doing the negotiating.
How we track this
We publish these numbers every Thursday, the day Freddie Mac releases the survey, and we pull them from the primary sources rather than secondhand summaries. Daily rate trackers will quote different averages because each one measures a different pool of loans. The figures above come straight from Freddie Mac, the Federal Reserve Bank of St. Louis and the Bureau of Labor Statistics.
Your own quote will differ from any national average based on credit, down payment, loan type and property. Download the Ready Front Real Estate app to track listings and payments with current rates built in.
Join the conversation
More from Ready Front Pulse
Where Buyers Are Still Paying Over Asking Around Austin
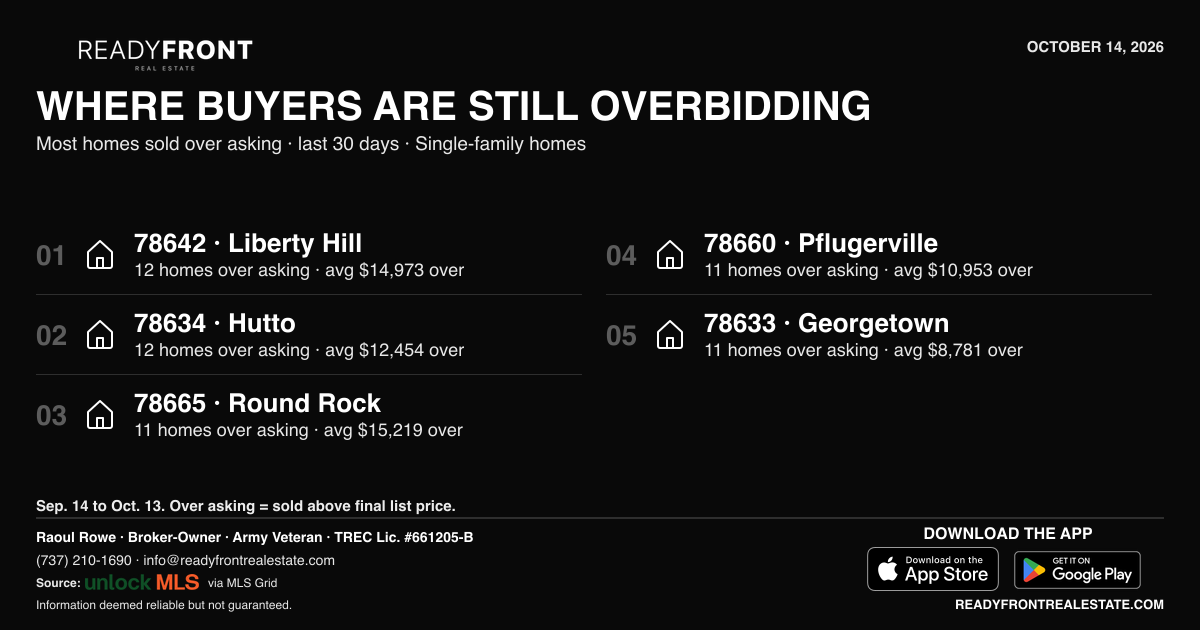
Liberty Hill leads the five Austin-area ZIP codes where the most buyers paid above asking in the last 30 days, followed by Hutto, Round Rock, Pflugerville and Georgetown.
Where Active Price Reductions Are Showing Up Around Austin
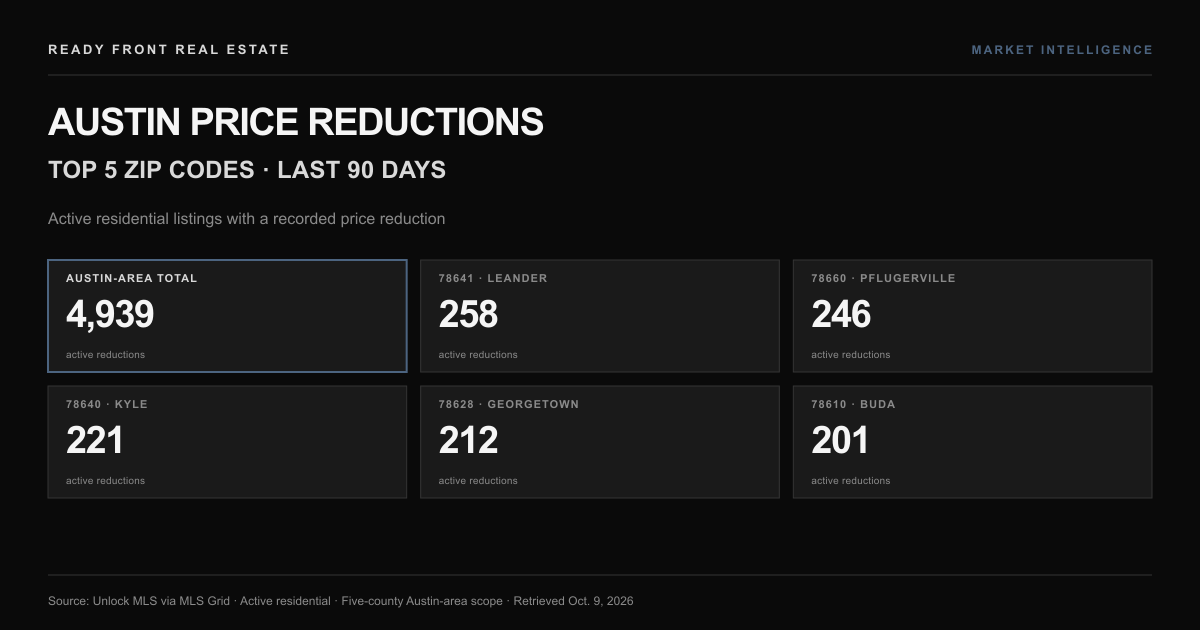
A live Ready Front MLS snapshot of the Austin-area ZIP codes with the highest counts of active residential listings that reduced their asking price in the last 90 days.
Mortgage Rates Moved from 7.28% to 7.40%: The Payment Impact on a $400,000 Home
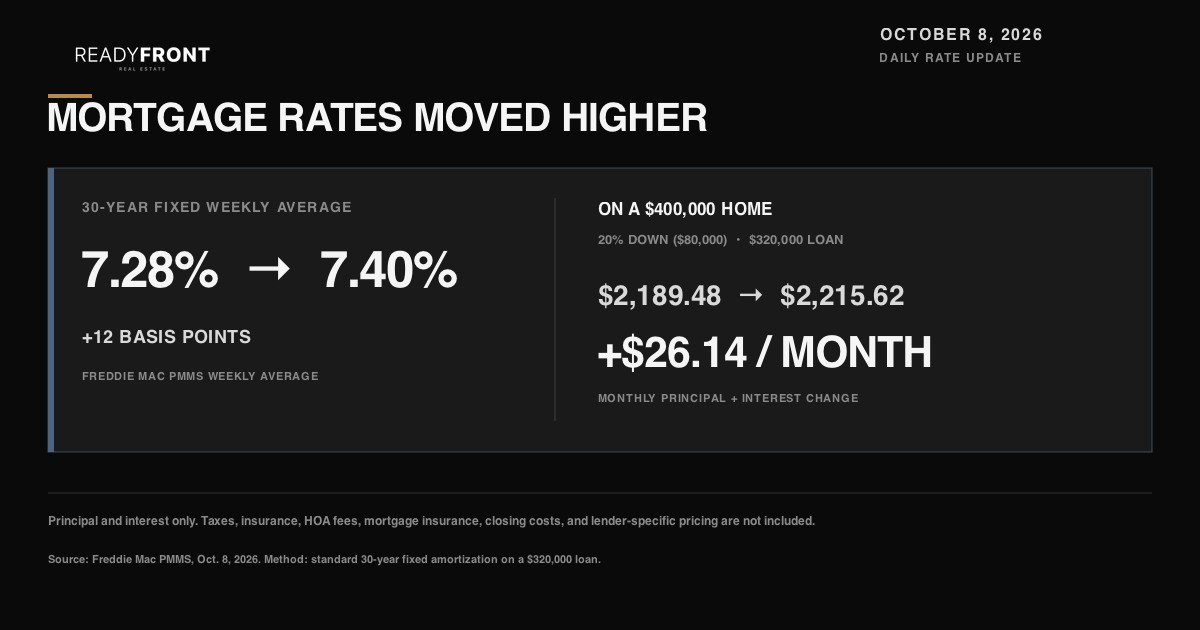
On a $400,000 purchase with 20% down, a move from 7.28% to 7.40% changes the modeled principal-and-interest payment by $26.14 per month.